

In late May, Crown Commercial Service (“CCS”) published the Digital Marketplace spend statistics for the last quarter of the financial year to 31 March 2024. Time for our Strategic Adviser Lindsay to look back over the year to deduce what is happening in this highly significant marketplace for public sector Cloud Services.
Executive Summary
- Digital Marketplace growth slows dramatically
- Negative growth in real terms
- 4 possible explanations
- Example of Large Enterprises increasing use of other channels
- This may be detrimental to the public purse
- DOS still growing healthily
- Professional Services over 70% of Digital Marketplace spend
- G-Cloud spending falls
- Software & Hosting grow 6% & 11%
- Leaderboards
- Is there a strategy or are we a figment of someone else’s?
Digital Marketplace Spend Data
It is a remarkable marketplace with over £4 Billion of transactions in each of the last 2 financial years.
A first observation, it is very clear from the shape of the curve that the rate of growth of the annual spending at the Digital Marketplace has abruptly plateaued.
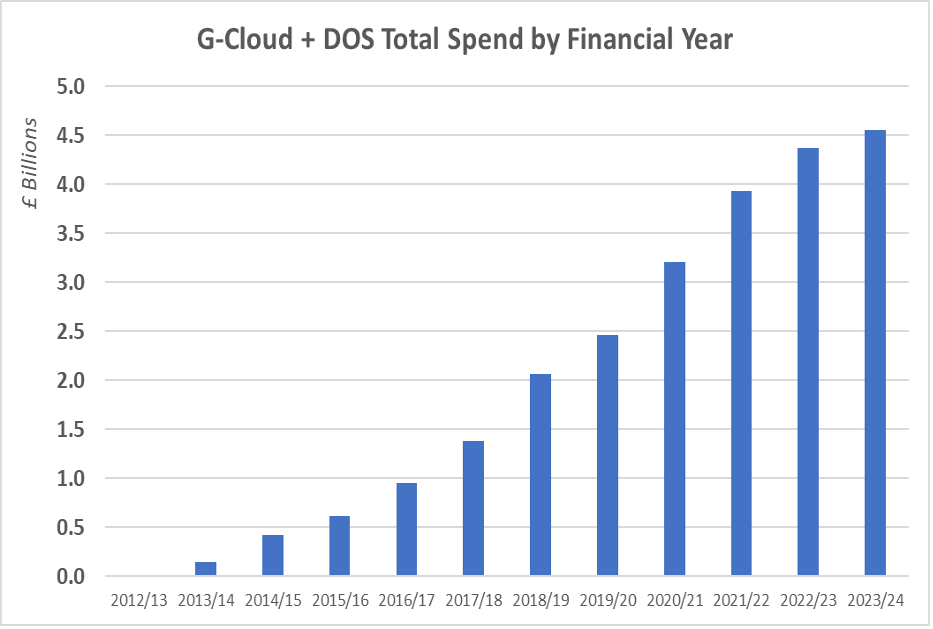
Ignoring the very high growth of the initial years, the period 2014 – 2019 was marked by stable, high growth. This started to abate in 2019/20, then the high spending in the pandemic years on Test and Trace and other pandemic related activities created a small bubble which in 2023/24 has fallen below the prevailing rate of inflation – so we can infer a fall in spending on Cloud services through the Digital Marketplace in real terms.
| Year | £Million | Y-o-y Growth |
|---|---|---|
| 2012/13 | 18.3 | |
| 2013/14 | 141.7 | |
| 2014/15 | 421.9 | |
| 2015/16 | 616.8 | 46% |
| 2016/17 | 949.2 | 54% |
| 2017/18 | 1,382.4 | 46% |
| 2018/19 | 2,063.0 | 49% |
| 2019/20 | 2,459.1 | 19% |
| 2020/21 | 3,203.7 | 30% |
| 2021/22 | 3,927.8 | 23% |
| 2022/23 | 4,375.4 | 11% |
| 2023/24 | 4,559.7 | 4% |
There are, in my opinion, 4 main candidates to explain what is going on:
- Cloud service prices are falling, low growth is an illusion.
- Spending on Cloud services continues to grow, but is being diverted to channels other than the Digital Marketplace.
- Departments are savagely cutting budgets and capex is being sacrificed on the altar of wasted opportunity.
- Digital transformation has stalled, through lack of political will, leadership or belief in the benefits.
Cloud Service Prices Falling?
No evidence supporting this was found in a study we performed on SFIA rate cards (Link: Professional Services Pricing Article) which showed Professional Service rates (the largest component of spend on the Digital Marketplace) rose an average of 11% from G-Cloud 10 to 13. Note however that this is slightly lower than CPI inflation over the 4 year period May 2018 – May 2022 which we calculate to be 13%.
Is spend being diverted to other channels?
Evidence does show that Cloud Service spending is finding other channels. Looking at Technology Services 3 (RM6100) demonstrates this quite well and may also have a negative connotation for our public procurement practices.
First, let me emphasise that RM6100 is not a perfect overlap for the Digital Marketplace services, but there is a considerable degree to which services could be structured to be available under each framework. It is only one of several channels that compete with the Digital Marketplace. It should also be noted that ‘Contracts Finder’ is not timely, complete and nor is the Awarded Value an accurate picture of what has actually been spent (it is normally a significant under statement), but it is indicative of where money may be going that could be going to the Digital Marketplace.
135 contracts are listed on Contracts Finder as having been awarded on RM6100 since late 2021 with a total value of £700m. Only 27 of which (value £24.6m) were with SMEs (3.5% by value).
G-Cloud was created in part because of the perception that Large Suppliers (the oligopoly) were not delivering good outcomes and were very poor value. There are over 4,500 SME suppliers on G-Cloud compared with about 150 on Technology Services 3. In 2023/24 SMEs were awarded 40% by value of all the spend on the Digital Marketplace.
Conclusion on low growth
Given that the Awarded Value of contracts on ‘Contracts Finder’ materially underestimates the actual spend, we can conclude from this exercise that a large and growing proportion of spend is finding its way into other channels. These channels probably have a much smaller SME population for a variety of reasons, but the lack of competition (by numbers) probably works to the benefit of the oligopoly and to the detriment of the public purse. To quote Francis Maude (link to speech in the ‘Conclusion’, at the end of this article):
“… an approach that was bad for users, bad for the taxpayer and bad for growth.”
As for the other potential causes for the real decline in spending on G-Cloud, it is beyond the scope of this blog to lift the bonnet on the state of departmental enthusiasm for Digital Transformation or the allocation of their budgets, but I would be surprised if these two factors did not have some influence on the lower spend.
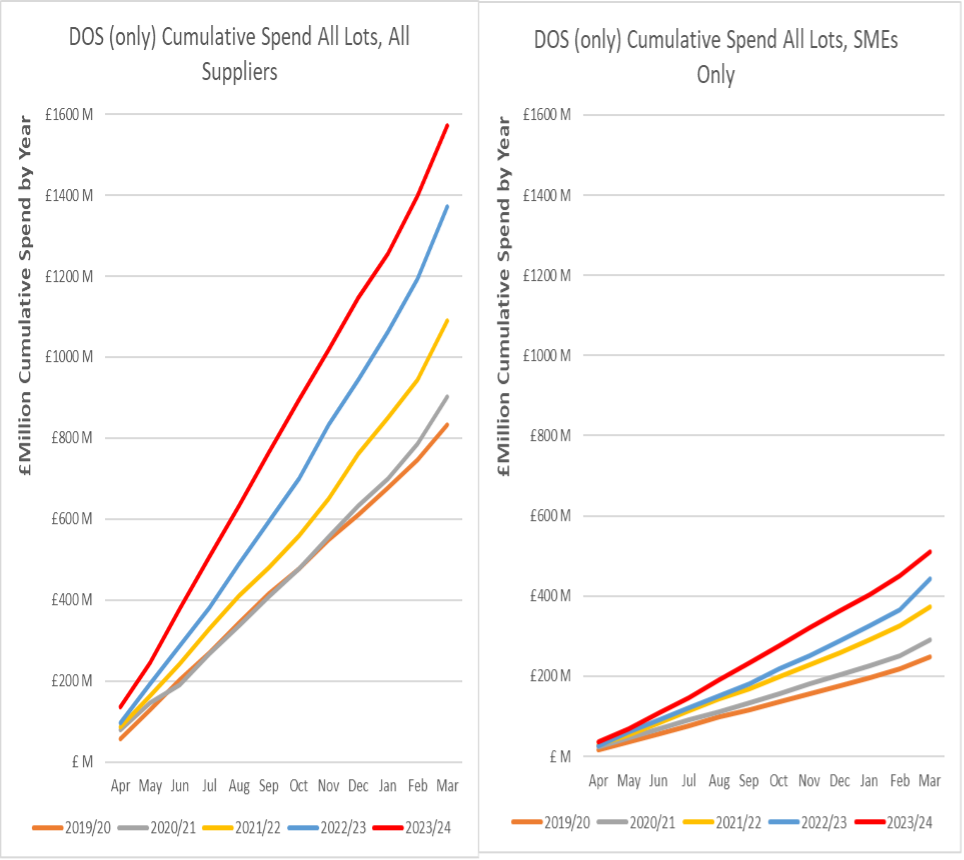
Continuing the trend of the previous 2 financial years, DOS (including Digital Capability for Health) has grown in real terms and now represents 34% of all spend on the Digital Marketplace, a position last held in 2019/20. DOS SME spend increased 15% over 2022/23, Large Enterprises grew 14% over the same period and as can be seen from the charts above, SMEs account for approximately 32% of the spend on DOS.
Professional Services
The largest proportion of spend on the Digital Marketplace goes to Professional Services, i.e. hiring people by the hour/day/month. To simplify the analysis, we can look at Professional Services being all of DOS and just the Support Lot of G-Cloud. In 2023/24 £3.26 Billion was spent on these people costs, this was only a 3% increase over the previous financial year and represents 71% of the total spend on the Digital Marketplace. At the blended average daily rate from analysis of SFIA rate cards this is roughly equivalent to 20,000 FTE people – on its own a cohort roughly 1/3rd the size of the headcount of HMRC, just through the Digital Marketplace.
Biggest Spending Departments on Professional Services 2023/24
| 2023/24 | Equivalent | Change | |
|---|---|---|---|
| £M | FTE/year | Over 22/23 | |
| MOD | 406 | 1,833 | 11% |
| Home Office | 400 | 1,803 | -3% |
| Health & SC | 355 | 1,602 | 5% |
| DWP | 255 | 1,152 | 12% |
| HMRC | 252 | 1,136 | -16% |
| MOJ | 210 | 946 | -11% |
| Cabinet Office | 169 | 764 | 63% |
We need to recognise that there are a number of significant approximations in these figures. Not all people costs have been counted (e.g. there will be a lot in Software and possibly Hosting Lots). The average blended daily rate calculated from the SFIA rate cards for G-Cloud 13 is a rough guide and ignores, for example, what is charged for travel & subsistence. But it provides an indication of how many consultants are engaged represented as Full Time Equivalent people seconded for the entire year.
G-Cloud
Spending across the whole of G-Cloud, which for the first time includes £565,000 on Lot 4, fell 1% to £2.988 Billion in 2023/24. The SME share of spend on G-Cloud rose 9% to £1.32 Billion (44%) and so the share of spend with Large Enterprises fell 7% to £1.669 Billion, perhaps another signal that Large Enterprises are encouraging their customers away from G-Cloud where numerically there is a lot more competition from SMEs. On G-Cloud 13 the work previously referenced on SFIA rate cards found that on average SME daily rates are 27% lower than the average for Large Enterprises.
Software
Software on G-Cloud accounted for 10.5% of the total spend on the Digital Marketplace (16% of G-Cloud) in 2023/24. This was an increase of 6% over the previous financial year, but the SME share of spend increased 22% to £479M now amounting to 53% of the total Software spend of £899M.
Hosting
At £402M Hosting accounts for 9% of Digital Marketplace spend (13% of G-Cloud) an increase of 11% over 2022/23. The SME proportion of Hosting spend was £41M (10%).
Leaderboards
Digital Marketplace Highest Grossing Suppliers
| 2023/24 (£M) | 2022/23 (£M) | Change | |
|---|---|---|---|
| Amazon | 250 | 238 | 5% |
| Capgemini | 182 | 171 | 6% |
| IBM | 120 | 95 | 26% |
| PA | 116 | 103 | 13% |
| Deloitte | 112 | 136 | -8% |
| BJSS | 95 | 102 | -7% |
| Cognizant | 80 | 107 | -25% |
| Kainos | 80 | 104 | -23% |
| Equal Experts | 78 | 99 | -21% |
| Accenture | 61 | 49 | 24% |
Digital Marketplace Biggest Spending Customer Groups
| 2023/24 (£M) | 2022/23 (£M) | Change | |
|---|---|---|---|
| Home Office | 522 | 529 | -1% |
| MOD | 499 | 437 | 14% |
| Health & SC | 417 | 419 | 0% |
| HMRC | 349 | 400 | -13% |
| DWP | 341 | 297 | 15% |
| Health | 322 | 339 | -5% |
| MOJ | 276 | 296 | -7% |
| Local Gov | 238 | 219 | 9% |
| Cabinet Office | 233 | 180 | 29% |
| Devolved Admins | 183 | 158 | 16% |
Conclusion
Having worked at Board level in global software companies I know that Large Enterprises have a documented and well communicated strategy for generating profitable growth out of the public sectors across multiple geographies.
In 2012 the government had a strategy for managing the suppliers of technology to be creative, dynamic, cost effective and accountable. This was very clearly articulated in Francis Maude’s speech at the World-Class Public Services Conference. It is well worth reading it, there is so much relevant to our present situation [Link]. Here are two extracts:
“…we have started to create a competitive and open marketplace from which we buy IT services and solutions – ending the oligopoly of large suppliers and opening up opportunities to new suppliers, including SMEs… Perhaps the best example of this is the launch of the G-Cloud framework…”
“…we need to be at the forefront of the Open Data revolution so we are exploiting our data resources to drive efficiency, increase choice and spur new growth.”
A competitive and open marketplace, Open Data – what good ideas! We seem to be drifting. I can assure you however, the oligopoly are not.