
This is Part Two of our G-Cloud Pricing Strategy Series written by Lindsay Smith. To read Part One, click here!
Executive Summary
- Summarising Part 1
- We select G-Cloud 12 to source adequate spend data
- Impact of Covid pandemic will create anomalies
- Disparity between prices offered still very high
- SMEs, excluding outliers is a more compact cohort
- Evidence of a spectrum of pricing-power
- Matching pricing-power to spend data
- Conclusion: pricing-power is important to pricing strategy
- What this means to price decisions for G-Cloud 14
Summarising Part 1
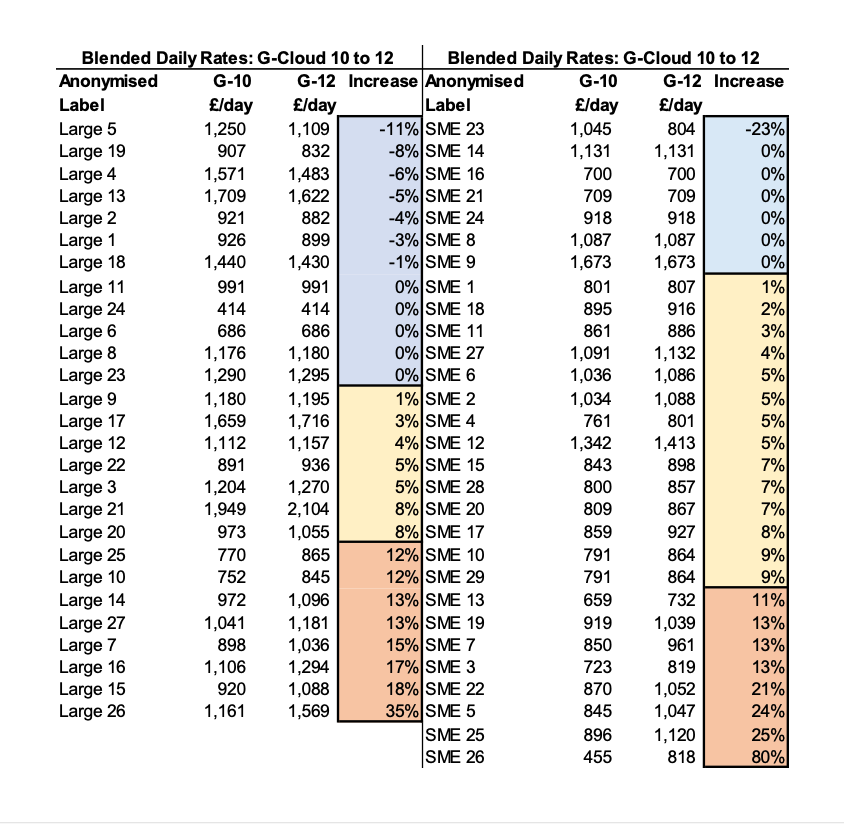
In Part 1 we looked for a consensus on how the 56 suppliers (27 Large, 29 SME) that accounted for 73% of total spend on Lot 3 (Support) had framed their professional services pricing strategy over a period of 50 months from the ‘go live’ dates of G-Cloud 10 to 13.
The analysis was based on the published daily rates on their SFIA (Skills Framework for the Information Age) rate card or its equivalent in the pricing documentation. To get a single price point to compare between the two frameworks we built a notional team of the 5 top SFIA skill/experience levels, weighted towards the lower grades, and dividing this by the number of people in the team we generated a single notional average blended rate. From this we generated a schedule of increases (or decreases) in percentage terms from G-Cloud 10 to 13.
The numerical analysis, together with looking at some of the underlying suppliers in depth, supported the hypothesis that there is a spectrum of service providers from highly competitive Commodity suppliers, where buyers can be very price sensitive, to Premium service providers with strong competitive ‘moats’ and differentiators which enable them to be more in control of their pricing options
Thus, we found no clear single strategy but, to reflect 3 sections of this spectrum, postulated a model of 3 strategies which are defined by the supplier’s behaviour in determining their pricing, reflecting their presumed assessment of their own pricing-power.
The 3 strategies have been superimposed on each cohort (Large and SME) in our sample of 56 suppliers, creating low, middle and high pricing-power groups, by reference to the percentage price increase they have submitted between G-Cloud 10 and 12.
The underlying assumption is that the suppliers we are looking at are highly sophisticated marketing organisations making rational choices. This is a fair assumption, many of the suppliers in the sample are well known brands, accounting for £billions of professional services sales across public and private sectors in the UK and internationally. It’s fair to assume that for the most part, they get their pricing decisions right.
What we are looking to achieve in this Part 2 of the story is to attempt to match our Large and SME cohorts and the low, middle and high pricing-power groups within them to the G-Cloud spend data to see if there is any evidence that high price increases lose business or low price rises (or reductions) win business, if that appears to be the case then the conclusion would be that price is more important to buyers and the perception of pricing-power is more illusory.
The Real World is Inconvenient
Unfortunately, G-Cloud 13 only has spend data for its first 9 months and as procurement, contracts and requirements gathering all take time, the spend data is too sparse to be very useful. To get a reasonable body of data to analyse we will reperform our analysis on the pricing for G-Cloud 12.
We are tracing the success of 56 suppliers over a relatively short period. It is unlikely that there will be more than 56 new call-off contracts signed and started which are large enough for us to trace the success of each of the 56 suppliers pricing decisions. But by combining our individual suppliers into price strategy groups, we may be able to interpret the relative success of the strategy for the group.
We look at the spend data for G-Cloud 12 (‘live’ in July 2020) and see what new business was generated by our cohorts in the 39 months to September 2023.
G-Cloud 12 was open for 26 months according to the CCS Agreements website, whereas G-Cloud 10 expired after 12 months. We should therefore expect G-Cloud 12 to accumulate approximately 116% more spend plus some allowance for organic growth (which has been low in the most recent period, growth in spend on Lot 3 in the 12 months to September 2023 was only 4.6% over the previous 12 months).
Against the trend of low organic growth, this period includes the massive disruption from the Covid Pandemic – which stimulated some G-Cloud spending, particularly in DHSC, Health, HMRC and DWP:
“The Covid-19 pandemic has caused an unprecedented surge in demand on DWP’s services, resulting in a hugely increased operational workload across the Department.” [Preamble to a £1m+ G-Cloud contract to one of our sample on the CCS Contracts Finder website]
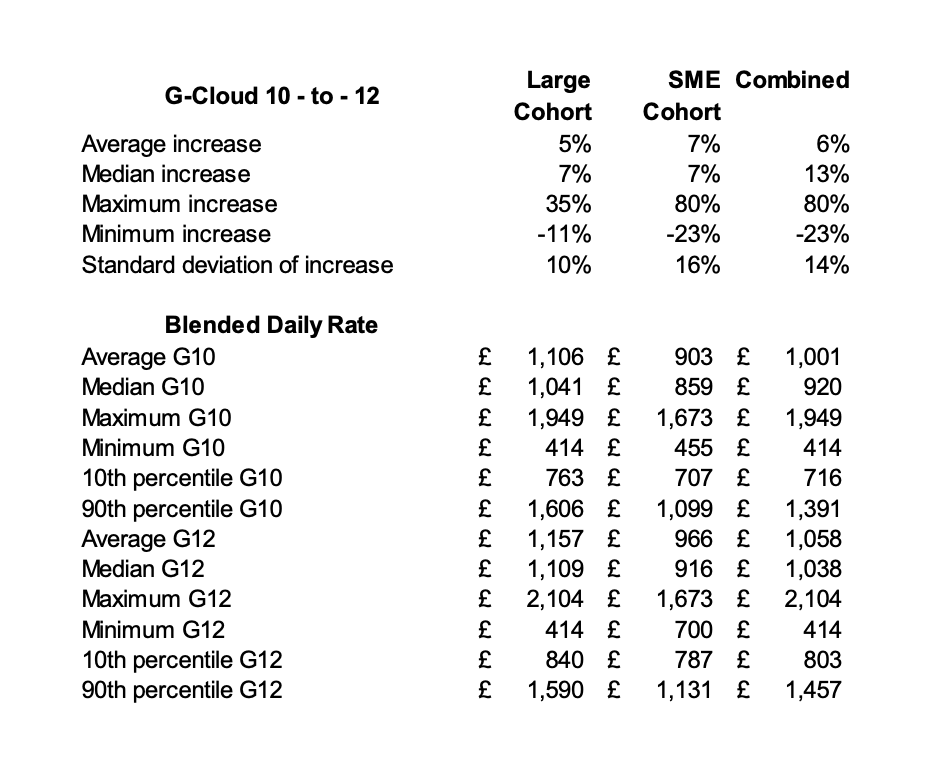
As with the sample in Part 1, this data exhibits a wide dispersion although a little tighter, as we would expect given the shorter duration between the two frameworks. It is noticeable that the SME cohort between the 10th and 90th percentiles at 1.4x is much tighter than the Large cohort at 1.9x. We consider that these figures still support a hypothesis that pricing strategy has to be mindful of where a supplier’s services are on the commodity/premium spectrum and possibly that SMEs have lower pricing-power than their Large competitors, which is itself in line with expectations.
Supplier submissions for G-Cloud 10 had to be presented by 23 May 2018, those for G12 by 22 April 2020, a period of 23 months. For insight into inflation between these dates we return to the ONS Average Weekly Earnings Index for Information and Communications workers (NSA ind index ibia/K5EX), the index actually fell over this period (from 179.6 to 178.3) although it does move erratically over short periods.
Results Matching Pricing Power to Spend Data
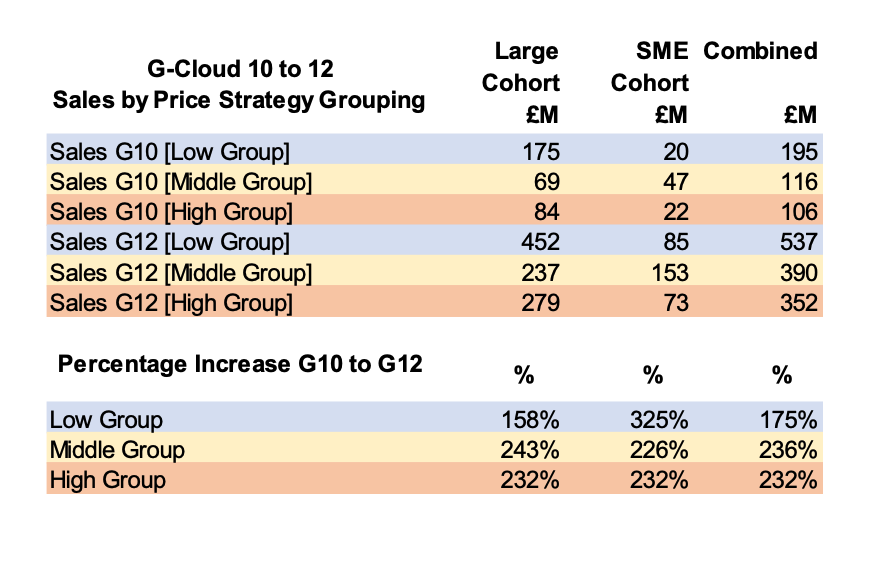
Spend attracted by suppliers on G-Cloud 10 and 12, stratified by assumed purchasing-power:
Commentary
This table has taken the pricing-power groups for each cohort, looked up the sales they have made, from the spend data published by CCS, in the first 39 months for G-Cloud 10 and then G-Cloud 12 and then calculates the percentage by which sales increased between the two frameworks.
Having stratified the two cohorts by the 3-tiers of assumed purchasing-power we see that each group in both cohorts increased sales by more than the 120% we would expect (due to the longer active period of G-Cloud 12 over G-Cloud 10, allowing for more call-off contracts to be executed, assuming they arise on a fairly regular basis). The Large cohort with the lowest price increases (a range from -11% to 0% inclusive) grew new business by the smallest percentage but from a high base whilst the opposite is true for the SME cohort’s Low pricing-power group.
The significant signal we are looking for is whether there is evidence that low price increases win business and high price increases lose business. If it exists, then it would contradict the concept that the wide variation in pricing behaviour indicates a spectrum of pricing-power. This is not the case. The strong performance, particularly of the middle and high group indicate that these suppliers know and are exploiting pricing-power. The strong performance of the SME low pricing-power group indicates that they may indeed face a much more competitive marketplace where buyers are price-sensitive and there is little other service differentiation.
Conclusion
We do not suggest the existence of 3 discrete pricing strategies based on pricing-power but use this model to test for a spectrum of pricing-power which we suggest is related to the commodity/premium nature of the professional service products provided by the suppliers. There will be several components of the marketing-mix which contributes to pricing-power: size, brand, reputation, access to proprietary technology and methodology and the ability to attract, retain and motivate the top talent.
To a supplier considering pricing for professional services for G-Cloud 14, particularly an SME supplier that does not enjoy the benefit of a large marketing function with a track-record of success, this emphasises the importance of assessing one’s place in the commodity/premium spectrum. It also provides a narrative as to how successful suppliers, both Large and SME have done this and appear to, on average, have got it right.
Further, it demonstrates the value of the spend data in identifying the successful peer-groups and the value of surveying their G-Cloud 13 prices and assessing what the average price movement will be between the present and the next framework.
Finally, it may illustrate the benefit of clearly articulating service pricing on an SFIA rate card, without using ranges, and taking advantage of discounts and price reductions (if needed) once the G-Cloud 14 rates are published.
The full table of suppliers sampled, and their pricing behaviour is attached as Appendix 1. For further insight into the Methodology adopted and its limitations, please refer to Appendix 2 in Part 1.