

CCS have announced that submissions for G-Cloud 14 are likely to start in February 2024 and are likely to be closed sometime in April for a ‘go live’ in November. Sixty percent of all G-Cloud spend is in Lot 3, the professional services category. One of the hardest jobs a supplier must decide is where to set the pricing levels for their professional services.
Our strategic advisor, Lindsay, has been looking at the data to help inform this decision-making process. Lindsay’s CV shows 10 years’ board-level experience in global B2B software organisations and the rest of his career has been spent in professional service consultancies, both large and SME, in consultant, managerial and leadership positions.
Executive Summary
- We look at how successful suppliers approach service pricing
- Look at their SFIA rate cards between G-Cloud 10 and 13
- Sample 56 SME & Large suppliers accounting for 73% of spend
- 75% of suppliers on G10 Lot 3 never made a sale!
- Vast disparity between daily rates and how they increased
- That’s because there isn’t one strategy, but a spectrum
- It’s clearly based on Pricing-Power
- Pricing decisions relate to our position on the spectrum
- Table: blended rates of the top suppliers and how they change
- Methodology and limitations
The SFIA Rate Card
Part 1 of this exploration of professional services pricing has been based on the analysis on published SFIA rate cards, comparing the changes in prices for a sample population of suppliers between G-Cloud 10 (‘live’ in July 2018) and G-Cloud 13 (September 2022).
The sample selected for the analysis was to take 2 cohorts of the most successful 30 suppliers on G-Cloud Lot 3 (Support) for the financial year 2022/23 one for Large Enterprises (referred to below as simply ‘Large’) and the other for Small & Medium Enterprises (‘SME’). This sample of 60 suppliers accounted for 75% of the total spend on Lot 3 in that financial year (Large 51%, SME 24%).
Some of the sample had to be eliminated as their pricing data was not published in a manner comparable with SFIA rate cards and the remaining 56 suppliers (27 Large, 29 SME) accounted for 73% of total spend of Lot 3 (Support) in 2022/23, a statistically significant sample.
Looking for Pricing Strategy G-Cloud 10 to G-Cloud 13
The SFIA rate cards for G-Cloud 10 are still displayed on the Digital Marketplace website, to which we have access through a record of the original URLs. So having the list of the SME and Large cohorts selected as described above from the most successful suppliers in 2022/23 we have generated a single ‘average blended rate’ from the SFIA rate cards as described in Appendix 2 of this discussion (Methodology Adopted and its Limitations).
We are now able, for the 56 suppliers, to trace what they have done to evolve their professional service rates over the 50 months and 3 iterations of the framework from the base case of G-Cloud 10. During this time Lot 3 (Support) spend increased by 108% from £857M in 2018/19 to £1,784M in 2022/23.
Other statistics of growth between suppliers’ offerings between G-Cloud 10 and 13 are summarised in the following table:
| Lot 3 (Support) | G-Cloud 10 | G-Cloud 13 | Increase |
|---|---|---|---|
| Number of Services | 16814 | 23630 | 41% |
| Number of Suppliers | 2210 | 2349 | 6% |
| Number of Suppliers with Sales in the last 13 months* | 508 | 571 | 12% |
*Only 13 months of GC13 data is available so G10 is restricted to enable comparison.
The number of ‘suppliers with sales’ compared to the total number of suppliers on the framework is always an interesting figure. We have restricted the view of G-Cloud 10 suppliers above to only show those with sales in the first 13 months of that framework, so that it makes a fair basis of comparison with G-Cloud 13.
However, the total number of suppliers making sales on G-Cloud 10 Lot 3 (Support) over the theoretical maximum lifespan of call-off contracts executed before expiry of the framework (1 July 2019) was 548. So roughly 75% of suppliers who had submitted to the framework never made a sale.
This has changed very little over the 11+ year history of G-Cloud and for many suppliers there are errors in the way they list their particulars on the framework that prevent a buyer from finding their service or being able to evaluate it or to issue a contract.
The 548 successful suppliers sold in total £1bn of professional services over the life of the framework, so it’s worth getting these impediments ironed out.
When setting prices for G-Cloud 10, suppliers were able look across all competitors SFIA rate cards on previous iterations. As each iteration from 10 to 13 evolved they would be able to look at competitors’ rates, and from the published spend data make some estimates of what pricing strategy works, what seems to not work as they develop their own pricing strategy.
Inflation between the Frameworks
In the interval between the final date for submission of pricing between the two selected iterations (May 2018 and May 2022) the ONS published an index of weekly earnings (including bonus & arrears) for the Information and Communications component of non-public sector industry. This shows inflation over this 4-year period of 22.7% (equivalent to an annualised inflation rate of 5.25% p.a.).
Summarised Pricing Data – G-cloud 10 to 13
| G-Cloud 10 to 13 | Large Cohort | SME Cohort | Combined |
|---|---|---|---|
| Average Increase | 12% | 9% | 11% |
| Median Increase | 15% | 7% | 13% |
| Maximum Increase | 56% | 88% | 88% |
| Minimum Increase | -5% | -14% | -14% |
| Standard Deviation of Increase | 14% | 18% | 16% |
| Blended Daily Rate | Large Cohort | SME Cohort | Combined |
|---|---|---|---|
| Average GC10 | £1106 | £903 | £1001 |
| Median GC10 | £1041 | £859 | £920 |
| Maximum GC10 | £1949 | £1673 | £1949 |
| Minimum GC10 | £414 | £455 | £414 |
| 10th Percentile GC10 | £763 | £707 | £716 |
| 90th Percentile GC10 | £1244 | £981 | £1108 |
| Average GC13 | £1244 | £981 | £1108 |
| Median GC13 | £1193 | £918 | £1036 |
| Maximum GC13 | £2104 | £1673 | £2104 |
| Minimum GC13 | £433 | £700 | £433 |
| 10th Percentile GC13 | £875 | £757 | £771 |
| 90th Percentile GC13 | £1678 | £1207 | £1545 |
We now look at the summarised data for the 56 suppliers to see if a consensus emerges which reflects a common pricing strategy over the 50-month period. The full data-set is shown in Appendix 1 to this discussion.
Inflation of roughly 23% and an average increase in the blended rate of 11% might be interpreted as a reticence to burden customers with the full cost experienced by suppliers in the marketplace – possibly explained as a concern that the highly competitive structure does not allow costs to be passed on. After all, there are 2,349 suppliers with full disclosure of prices for services essentially being delivered by people with skills and experience that are accessible to all in the employment marketplace. This interpretation of the pricing strategy, that supplier’s profits must be given up to maintain a foothold in G-Cloud, which was specifically designed to bring competition to the Public Sector procurement of Cloud services, is prima facie very compelling. In our opinion, it is also wrong.
We are not looking at 1 pricing strategy
It becomes evident when we move away from the average and median figures and look at the dispersion (spread) of the results that there are very different strategies being deployed. The difference between the maximum and minimum blended rates on G-Cloud 13 for the Large cohort is almost 5 times. If there was a shared consensus for what these successful suppliers of Cloud oriented professional services to the public sector should charge per day for personnel at fairly tightly defined levels of skill and experience under the SFIA standard, and where everyone can see what the others are charging – we should expect fairly tight bunching of rates for each grade.
Eliminating the extreme outliers by looking at the 10 and 90 percentile values helpfully reduces the dispersion between the higher and lower average blended rate to 1.6 times for SMEs and 1.9 times for Large enterprises. That distinction between SME and Large makes some sense as the Large enterprises do have significant competitive ‘moats’ to protect their ability to maintain prices. One obvious example is their size, large teams were needed in the Covid pandemic, sometimes only the large integrators could deliver them.
Which brings us to the conclusion that we are looking at different pricing strategies based on features such as size, access to proprietary technologies and the spectrum of commodity to premium offerings. In other words, we are looking at Pricing-Power.
In theory any business paying the going rate for skill and experience can choose to sell services at the top end or the bottom end of the skill spectrum. Looking in depth at some of these suppliers and their average consultant wage bill (data from Companies House) clearly shows that some suppliers do choose to position themselves in these different segments of the market.
What are the pricing strategies?
It would seem that a few suppliers have changed their price from G-Cloud 10 to 13 as a radical reaction to something, either discovering their prices are too much higher than their peers or too much lower. The latter could be as a result of doing the analysis of their peers in the way it has been done here and finding they are significantly low-balling the market. The former may be as a result of buyer feed back identifying a lost opportunity based on price.
But setting these radical changes apart as they are stochastic in nature and can’t be easily modelled, we can express 3 ‘model’ pricing strategies essentially following pricing-power:
- Cut price, stay still or increase very much lower than inflation.
- In the middle, probably lower than inflation.
- Exploit your strong differentiation and go for high increases.
Which of these works best and should Large & SMEs approach pricing strategy differently?
This is the question we address in part 2 of this discussion when we combine the data for suppliers grouped by the 3 strategies with the published spend data.
Appendix 1: Raw Data
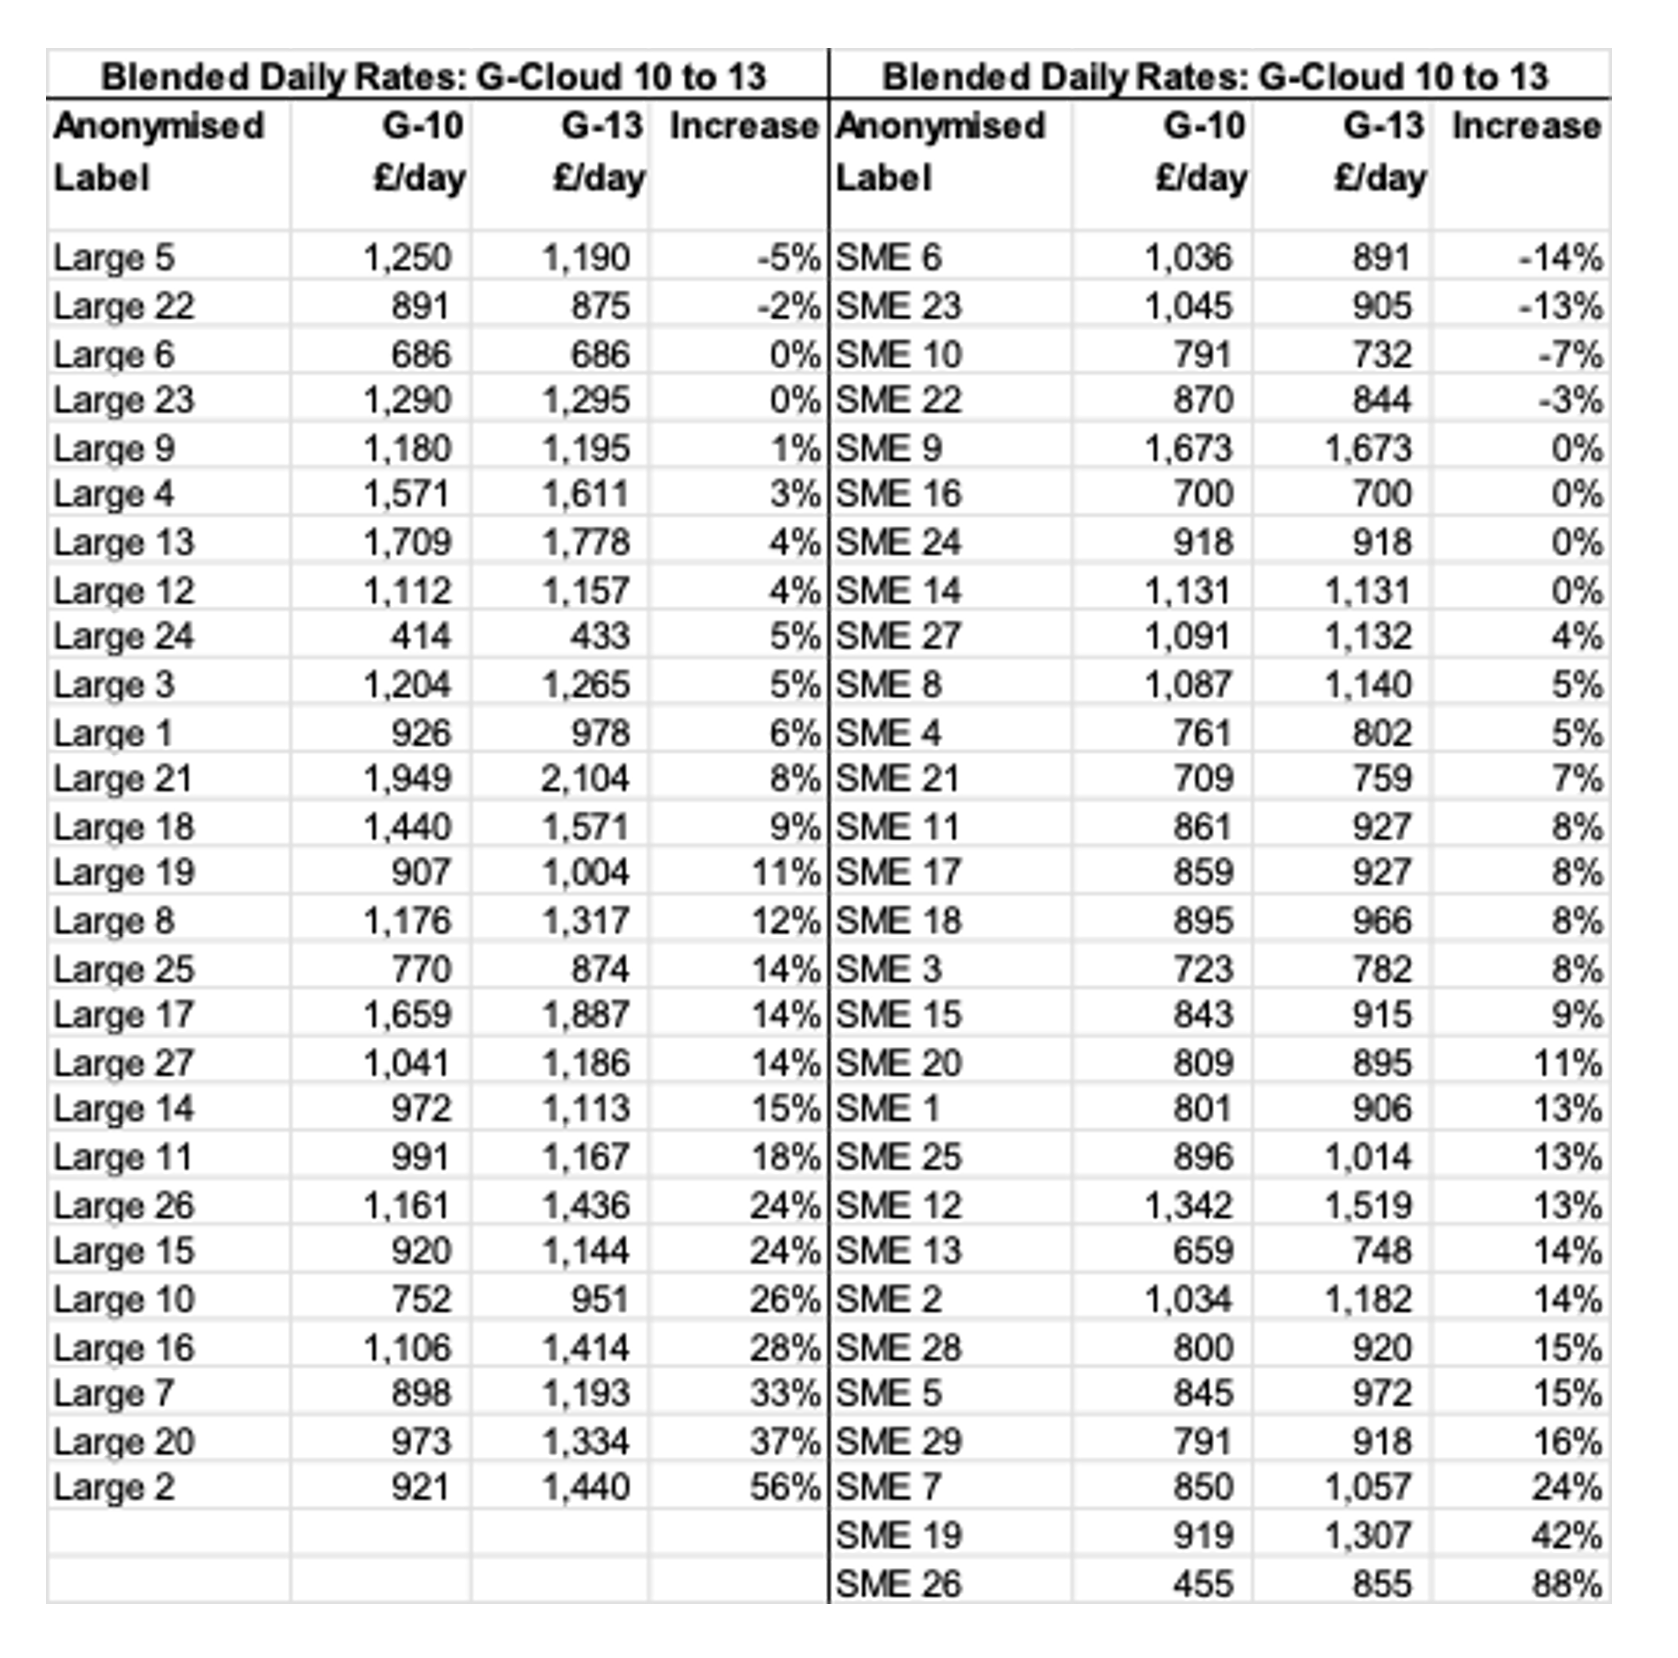
The table below shows the raw data, the calculated average blended daily rate for the hypothetical team on G-Cloud 10 and 13. I have anonymised the suppliers with a randomised token not associated with alphabetical order or spend ranking not only as a courtesy to suppliers but also because seeking out familiar names acts as a distraction when we are looking for an overall trend.
Appendix 2: Methodology Adopted and its Limitations
For G-Cloud 13 and prior iterations, suppliers were instructed to make clear and unambiguous prices for their services in a pricing document and were also able to specify daily rates by submitting an SFIA rate card (Skills Framework for the Information Age).
Weaknesses in using rate cards
There are several ways of charging for professional services. One of the most common is an hourly or daily rate, but a supplier of professional services may choose to quote a price for delivery of an outcome or a fee per month for access to support, etc. Several of the suppliers in the samples used in this analysis indicate these alternative billing models in their pricing documentation which may indicate that the SFIA rate card is not an accurate reflection of the prices charged to buyers.
People and teams work at different speed in the delivery of a service (perhaps due to more painstaking testing and review or the deployment of teams of different experience structures or other factors impacting efficiency) which is another reason why a comparison of daily rates may not be a fair comparison of the prices actually charged to buyers for a service. Nevertheless, the SFIA rate card or its equivalent in a pricing document is an important first step for a buyer assessing competing suppliers of a required service. For this analysis, reviewing professional pricing changes over time, it is the only source of readily comparable data that is available.
Other practical limitations on the simple analysis of changes in rate cards include the ability to reduce prices during the lifetime of a framework or offering discounts, which may mean this analysis is not looking at the price offered for the duration of the framework.
Commodity Vs Premium services are an issue which will again impact the formulation of conclusions about pricing strategy. Looking further into the detail of offerings show that, for example, some of the successful suppliers with very low pricing are temp agencies with relatively inexperienced staff, a highly competitive area where price is key and the ability to lift pricing is going to be limited.
Suppliers whose pricing approaches the median for the sample, while still temp agencies, exhibit an increased specialism with increasing skill and experience levels conferring an ability to differentiate based on service and pricing becomes a smaller component of the marketing mix.
At the upper end of the pricing tree are the large integrators, global consultancies and integrated Cloud providers with significant competitive ‘moats’ supporting their ability to have more control over pricing. So, we may expect pricing strategy to be subject to different factors as we move across a spectrum of commodity to premium services.
As we are tracing the same individual company’s prices from G-Cloud 10 to 13, if they were largely providing (say) premium services in G-Cloud 10, it is likely they will be doing the same on 13, so we should be able to identify trends in pricing strategy although we may need to interpret them by reference to the commodity/premium spectrum.
Methodology
There were 2,333 unique suppliers on G-Cloud 13 offering at least one Lot 3 (Support) service on June 1st, 2023 (the date of capture of the data used in this analysis). Of these 64% published at least one SFIA rate card and many of those not doing so published an SFIA compatible rate card as or included in their pricing document. A supplier can publish different rate cards for different services, and some publish different rates for onshore, nearshore and offshore staff. Other variations include publishing a range of rates or no rates for certain skill levels and service type.
CCS expressed the following in response to a query about the admissibility of rate bands or ranges in the pre-close clarification questions to G-Cloud 13:
“Pricing is set out in clause 3 of the Framework Agreement. If applicable a SFIA rate card may be used as a pricing document. Listing a minimum price is not permitted. Pricing documents should clearly lay out complete pricing models and any form of discount structure. This should include applicable unit prices and volume discounts. Price ranges are not permitted, however multiple rates can be included on price lists or SFIA rate cards.”
Discounts (which must be accessible to all buyers) are permitted and the Framework Agreement includes this clause:
“3.3 Discounted pricing periods may be considered on an individual basis, and subject to CCS approval.”
In performing this analysis, we have had to simplify the model to ignore discounts, using only onshore rates (where disclosed) and when pricing is expressed as a range, we have used the higher value. In addition, although a supplier may publish different rate cards for different services, we have randomly selected one rate card for each selected supplier in the sample population.
A common simplification to derive a single figure from the rate cards for comparison over time is to calculate a ‘blended rate’, which is to create a notional ‘team’ of different skill levels and divide it by the number of members of the team. The example we have employed is generated as shown in the following table:
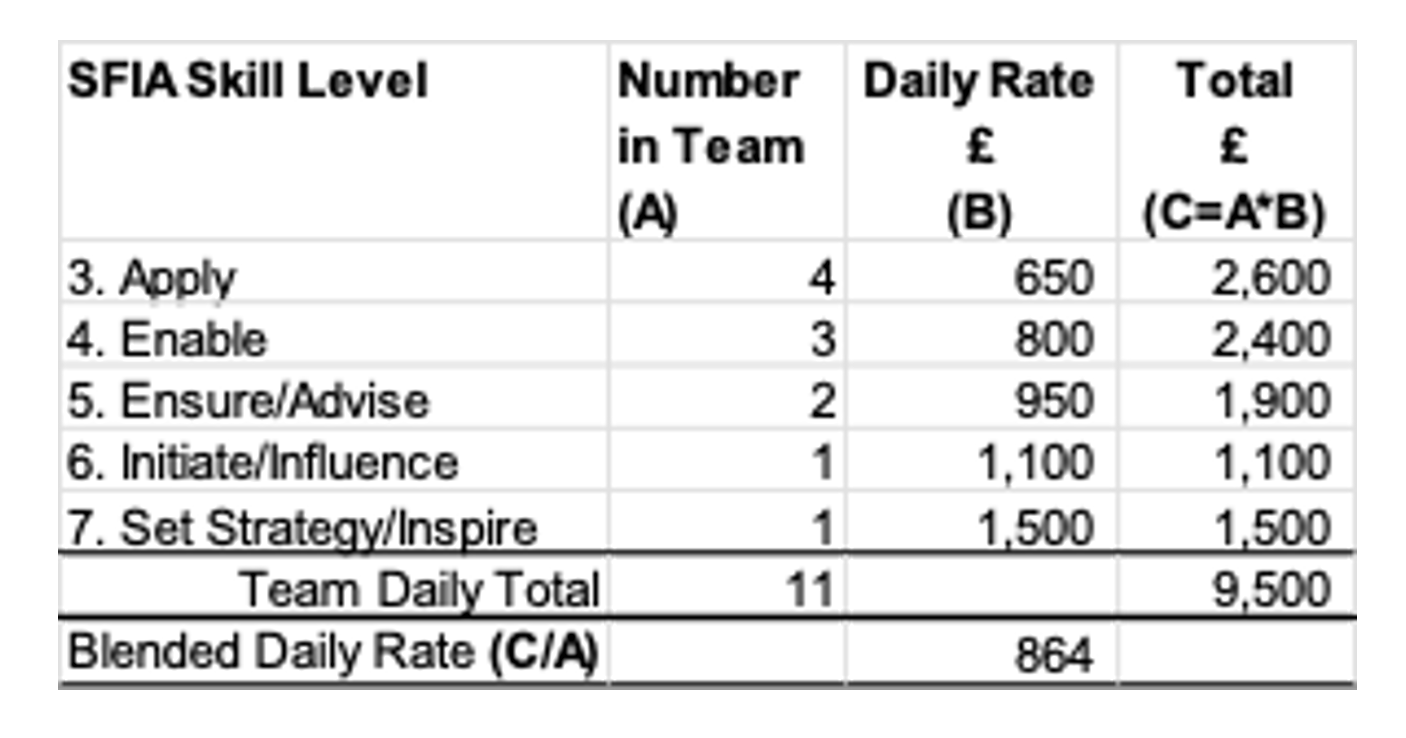
The daily rates in the above table have not been taken from any particular supplier. After reviewing the data, we have chosen to not include the two most junior skill levels (1. Follow, 2. Assist) as some of the rates quoted are anomalous. There is a possibility that some suppliers have shown very low daily rates for these levels while not intending ever to deploy staff in the junior categories. This would have the effect of distorting a ‘blended rate’ comparison in their favour.
Some suppliers do not publish a daily rate for the skill level ‘3. Apply’, in this case we have reduced the nominal team size from 11 to 7 and generated the blended rate accordingly.