

In August, Crown Commercial Service (“CCS”) published the Digital Marketplace spend statistics for the first quarter of the new financial year to 30 June 2023. Taking a break from his sun-lounger in the beautiful costa-del-Bedford, our Strategic Adviser Lindsay pokes a stick in the data to see if there’s anything happening in the public sector consumption of Cloud services that we should know about.
Digital Marketplace Spend Data – Context
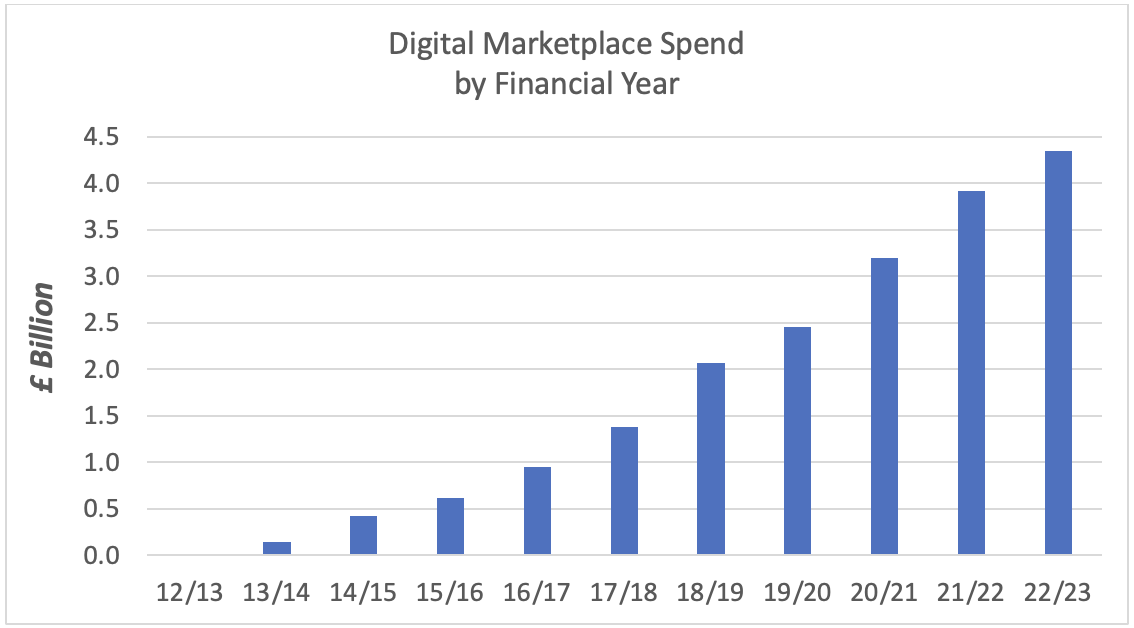
Large numbers are confusing, and the Digital Marketplace has grown to a large number, £4.35Bn in 2022/23. To attempt to give some context, the total take of income tax in 2022/23 was £247Bn and total spending on Defence in the UK was £55Bn. So, public sector spending on Cloud services in this channel has grown remarkably in just over a decade – to a level which is 240 times the value spent in the first year 2012/13.
And what does the first quarter of 2023/24 add to this phenomenal narrative?
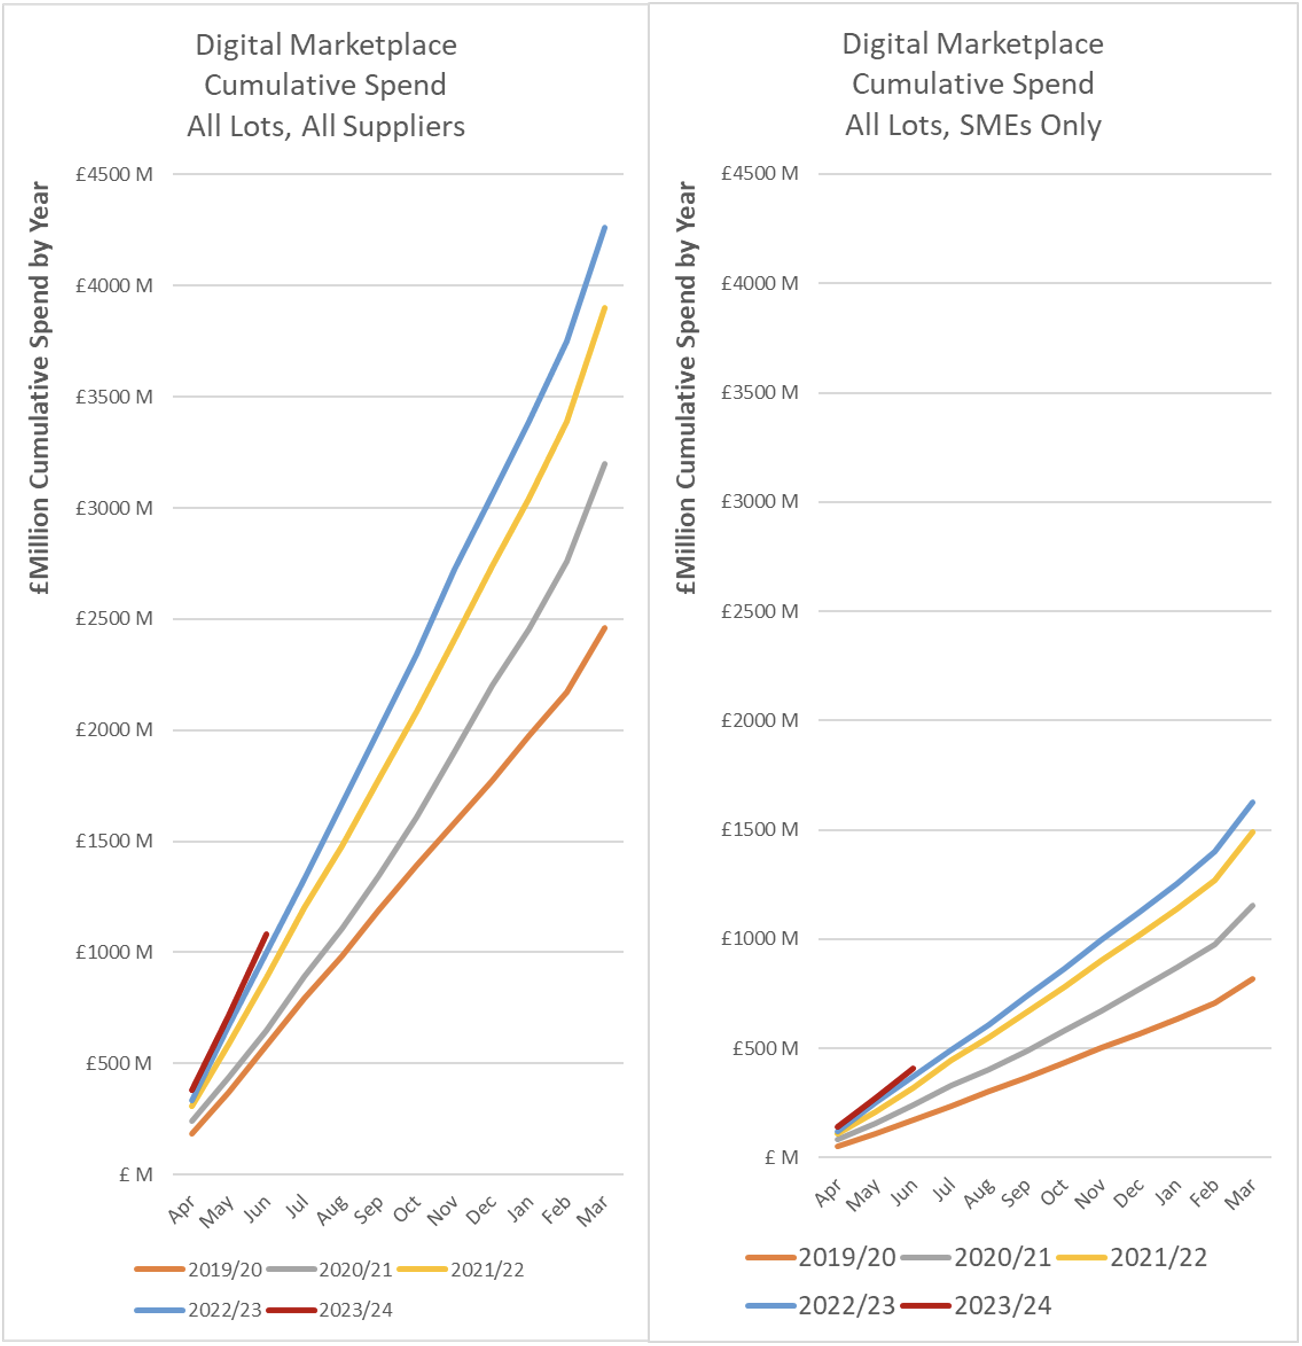
… Virtually nothing. The thin red line of accumulated spending in Q1 is almost glued to the spend of the previous year.
Of course, what we are witnessing is an apparent pause in the ‘rate of change’ of spend on Cloud services on this marketplace. We are still expecting the total spend to be in Large Number territory and rates of change tend to decline as aggregates get larger, but this is quite a remarkable change from the 10-year pattern and so it is worthy of exploring to see if we can infer a macroeconomic shift in our public sector consumption of Cloud services and what this might imply for the participants in the market.
First Quarter 2023/24 in Numbers
First, let’s pin down the issue in precise numbers. Q1 spend on the Digital Marketplace is always timid by reference to the ‘March Madness’ that occurs in the preceding quarter, fuelled by public sector budgeting/accounting that remains an anachronistic embarrassment and is a waste of resources that benefits the large consultancies that can ‘bank’ unutilised budget.
Here are the first quarter spend data for the full Digital Marketplace since G-Cloud started in 2012/13.
Digital Marketplace Spend in Q1 of each financial year:
| Year | £ Million | YoY Growth % |
|---|---|---|
| 2012/13 | 1.2 | |
| 2013/14 | 15.1 | 1173 |
| 2014/15 | 73.9 | 388 |
| 2015/16 | 117.9 | 60 |
| 2016/17 | 193.2 | 64 |
| 2017/18 | 279.6 | 45 |
| 2018/19 | 462.2 | 65 |
| 2019/20 | 583.5 | 26 |
| 2020/21 | 646.4 | 11 |
| 2021/22 | 887.7 | 37 |
| 2022/23 | 999.7 | 13 |
| 2023/24 | 1,081.6 | 8 |
“Unprecedented” can only just be applied to the low growth of the present period, as it almost matches that of 2020/21. But the UK Covid lockdown commenced on 26 March 2020 and the impact on public sector activity through the first quarter of 2020/21 was an exogenous stochastic event that does not help explain the present low growth.
There are several possible explanations for a sudden reduction of growth of public sector investment in Cloud services. Of greatest concern would be abandonment of investment in digital transformation. If this were to be the cause, we would be unable to identify it from the Digital Marketplace figures on their own. We need a wider perspective for which I turned to Rob Anderson (Public Sector Research Director at Global Data):
“I don’t think there’s been a significant downturn in cloud adoption. Whilst spending overall may be down a little due to extra pressure on public sector budgets, I think it’s more to do with a shift in routes to market. We are seeing a swing back toward more traditional SI’s and away from a broader supply chain.”
Anderson went on to name Technology Services 3 as being an example of a channel that could be drawing business away from the Digital Marketplace. Contracts Finder (which is neither complete nor always a timely source of data) shows 96 contracts awarded on RM6100 with a total Awarded Value amounting to £374m starting from late 2021. (Note that Awarded Value is not an accurate source of actual spend.) Of the 50 suppliers named, many are recognised as also being present on the Digital Marketplace, so this, while far from a proof, is supportive of Anderson’s conjecture.
Drill down into the detail
Digital Marketplace Q1 2023/24 Change in Spend over Q1 2022/23 – By Lot and Supplier Size:
| Large | SME | Total | ||||
|---|---|---|---|---|---|---|
| £m | % | £m | % | £m | % | |
| DOS | 65 | 36.1 | 7.4 | 8.0 | 72.4 | 26.5 |
| Support | -14 | -5.5 | 12.6 | 7.2 | -1.4 | -0.3 |
| Prof Services | 51 | 11.7 | 20 | 7.5 | 71 | 10.1 |
| Software | -11.7 | -10.9 | 16 | 16.8 | 4.3 | 2.1 |
| Hosting | 9.1 | 11.1 | -2.5 | -22.1 | 6.6 | 7.1 |
| G-Cloud | -16.7 | -3.7 | 26.1 | 9.3 | 9.5 | 1.3 |
| G-Cloud + DOS | 48.3 | 7.7 | 33.6 | 9.0 | 81.9 | 8.2 |
The reduction in rate of growth is not universal. DOS, which accounted for roughly 30% of the Digital Marketplace grew over 26% in Q1 2023/24 over the corresponding quarter in the previous year. It is also worth noting that the growth of spend to Large enterprise suppliers on DOS was over 36%, dwarfing the increase in spend to SMEs, the very opposite of what we see happening in G-Cloud. Of the overall growth of 8% in the Digital Marketplace, almost all is attributable to the growth in DOS alone.
On G-Cloud, the growth of spend to SMEs in Q1 was over 9% while spend to Large enterprises fell by almost 4%. Support (Professional Services) represents roughly 60% of spend on G-Cloud and this fell back a little comparing quarter with quarter. Large enterprise Software spend reduced considerably while SME software spend grew quite strongly. SME Hosting dropped (reflecting the demise of UKCloud.
The overall reduction in spend to Large enterprises on G-Cloud may also support the thesis that Cloud services spend may be finding its way to suppliers through new channels, as these large firms are often listed on multiple frameworks while SMEs find the overhead of so doing uneconomic and in some cases consider frameworks like Cloud Compute 2 hostile to SMEs (link to Computer Weekly article).
But it isn’t until we start breaking down the spend pattern by customer group and supplier that we can understand some of the dynamics behind what appears to be a lacklustre performance of G-Cloud.
Change by Customer Group
| Q1 22/23 (£M) | Q1 23/24 (£M) | Change | |
|---|---|---|---|
| D Health & SC | 81.6 | 40.9 | -50% |
| Cabinet Office | 46.9 | 30.9 | -34% |
| D Education | 16.8 | 11.2 | -33% |
| DEFRA | 19.3 | 14.4 | -25% |
| MoD | 106.1 | 81.7 | -23% |
| Devolved Admins | 45.8 | 42.4 | -7% |
| Home Office | 82.1 | 76.3 | -7% |
| Health | 113.5 | 109.3 | -4% |
| MoJ | 54.9 | 56.5 | 3% |
| D Transport | 39.3 | 41.2 | 5% |
| Bluelight | 16.3 | 18.0 | 11% |
| HMRC | 43.4 | 51.5 | 19% |
| Local Government | 45.1 | 58.1 | 29% |
| DWP | 59.4 | 78.8 | 33% |
The large drop in Q1 spend by the department of Health probably relates to Covid Pandemic spending coming out of the figures between the two first quarters, principally on test & trace (Deloitte). This may also be true to some extent of the Cabinet Office spend. Insufficient evidence exists on Contracts Finder to identify the probable causes behind the other negative changes, but reasonable increases in the lower half of the table are equally evident.
Supplier Leaderboard
| Q1 22/23 (£m) | Q1 23/24 (£m) | Change | |
|---|---|---|---|
| AMAZON WEB | 63.0 | 68.9 | 9% |
| IBM | 10.7 | 25.0 | 133% |
| CAPGEMINI | 14.3 | 16.1 | 12% |
| MICROSOFT | 12.8 | 15.2 | 19% |
| CIVICA | 9.6 | 13.5 | 40% |
| OUTCOMES BASED HEALTH | 1.6 | 11.0 | 584% |
| SOFTCAT | 8.1 | 9.6 | 19% |
| DELOITTE | 16.8 | 8.7 | -48% |
| PA | 20.4 | 7.7 | -62% |
| ACCENTURE | 7.6 | 7.5 | -2% |
| METHODS BUSINESS | 6.5 | 7.2 | 12% |
| GARTNER UK | 9.7 | 7.1 | -27% |
| COGNIZANT WORLDWIDE | 30.0 | 6.5 | -78% |
| BAE | 13.7 | 6.2 | -55% |
| KPMG | 3.8 | 6.1 | 64% |
| SOLIRIUS | 4.9 | 6.1 | 23% |
| JANE'S | 3.8 | 5.7 | 49% |
| BJSS | 6.9 | 5.2 | -25% |
| ATOS IT | 5.2 | 4.7 | -10% |
| MASTEK | 7.2 | 4.1 | -43% |
No surprise to see Amazon Web Services leading the supplier spend list in Q1, it has been the recipient of the largest spend on G-Cloud since 2019/20. The 6th highest spend in the quarter went to Outcomes Based Healthcare Ltd which, according to the unaudited accounts filed at Companies House, had an average of 11 employees in the year ended March 2023.
Solirius is also an SME, providing professional services, as does Deloitte, but their SFIA rate card has a top rate of £1,000 per day compared with £2,600 from the larger firm.
Conclusion
The weak growth exhibited in Q1 23/24 on the Digital Marketplace is probably caused by a combination of forces being the ‘base effect’ of emergency spending during the Covid Pandemic dropping out of the picture while spending on Cloud services to Large enterprises is being channelled off G-Cloud to other procurement platforms.
Given that the founding principles of G-Cloud included opening the market to access the economy, innovation and flexibility of SMEs, the move to alternative channels which are dominated by Large enterprises seems a retrograde step.
Before sleepwalking further in this direction, it would be sensible to address the question: ‘was the strategy behind G-Cloud wrong?’ There is now 11-years of evidence at hand with which to provide an answer. The result should inform strategy and policies to provide the best solutions to public sector through the most economical channel while encouraging and supporting our tech industries on which our future sustainable competitive advantage, prosperity and growth depend.
That calls for leadership, a distinctly rare commodity of late.