Know who is selling and buying
G-Cloud Spend Data
Who is using the G-Cloud framework?
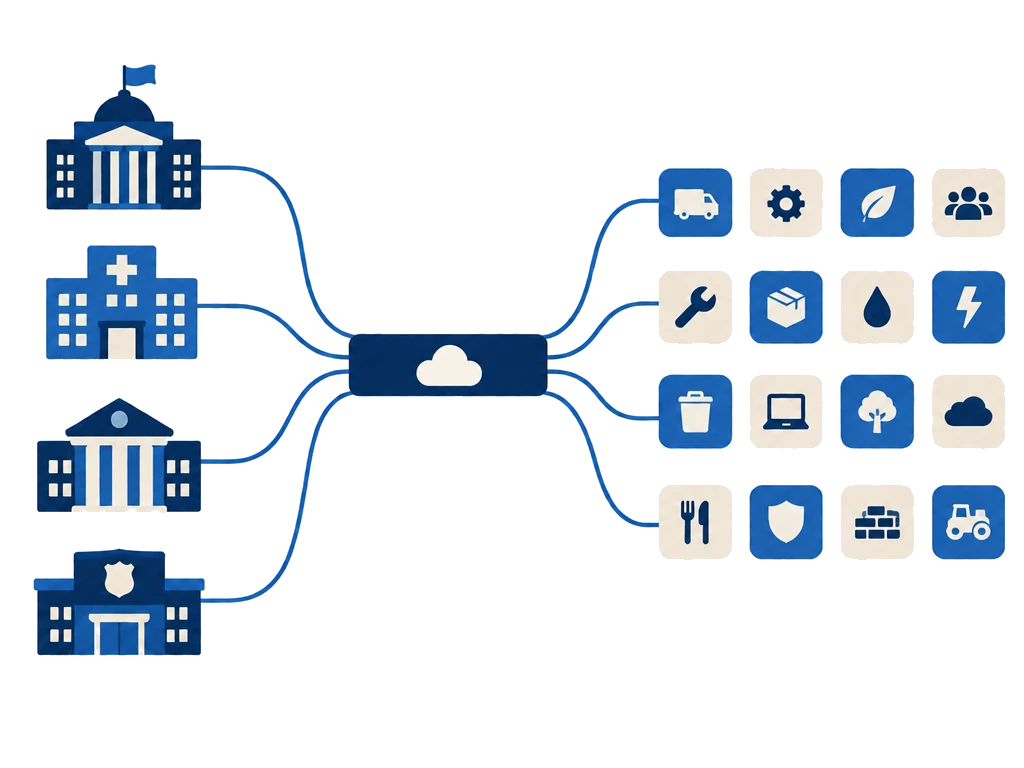
G-Cloud is the Government Framework designed for suppliers to sell cloud technology to the public sector. Since it launched, government departments, NHS trusts, local authorities and police forces have spent tens of billions through the framework.
The dashboard on this page shows you exactly which buyers are spending and with which suppliers. The figures below give you the headline position, and then the dashboard is where you find spend by supplier, by buyer, by lot, by sector and by month.
What are the headline G-Cloud spend figures?
- Total spend to date
- £25.5bn
- Since G-Cloud launched in 2012
- Spend, 2025/26 financial year
- £3.25bn
- April 2025 to March 2026
- Live suppliers
- 4,233
- Currently listed on the framework
- Top Lot by spend
- Lot 3 - Cloud Support
56% of total spend
- Spend with SMEs
- £9.5bn
37% of total spend
Data to the end of . Source: Government Commercial Agency Digital Marketplace sales data. Current totals are available in the live report below.
How to use this data
Suppliers already on G-Cloud
- Benchmark your performance against similar suppliers in your Lot.
- Filter by a competitor to see their buyer base and growth trend.
New to G-Cloud
- See total spend by Lot to size the opportunity before you apply.
- Spot Lots with lower supplier density relative to spend.
Buyers & procurement teams
- Sense-check the market before you go out to tender.
- See whether a category is supplier-concentrated or has a healthy spread.
G-Cloud Spend Data Reporting Tool
Open reportIf you haven't already, begin by accepting the cookies. Then use the filters or click on the report elements for a closer look. Start by filtering to your own company name, then switch to a competitor to compare.
How to use the G-Cloud spend data reporting tool
The dashboard below is interactive, and 3 steps will get you to an answer.
Set the filters that matter to you
6 filters control what the dashboard shows: Sector, Supplier, Customer, Month, Year of Reporting period and Lot Description. Start with the ones that match the question you came with.
Pick the view that answers your question
The views run across spend trend, sector, suppliers, customers, lot type and organisation size. So you can approach the same data from whichever direction suits your question.
Click through for a closer look
Use the filters, or click on the dashboard elements, for a closer look.
Explore the live G-Cloud report
This report is hosted by Tableau Public. Loading it connects to Tableau and may allow third-party cookies or browser storage, so it only loads once you have accepted embedded content cookies.
Cookie informationGet the G-Cloud Spend Report, straight to your inbox
Every quarter we pull the headline trends into a short, plain-English report: top-moving suppliers, biggest-spending buyers and category shifts.
Frequently asked questions about G-Cloud spend data
How much has been spent through G-Cloud in total?
What's the difference between G-Cloud 1-8 and G-Cloud 9 onwards in this data?
How can I find out who my competitors are selling to on G-Cloud?
What do these figures count?
They count sales reported through G-Cloud and published by GCA in its monthly sales data. We have combined the G-Cloud 1 to 8 spend data with everything from G-Cloud 9 onwards, so that searching and finding information stays consistent across the whole series instead of breaking at each new iteration of the framework.
The dimensions in the dashboard mean the following here.
- Supplier. The company that sold the service. Filter by Supplier to see what a named company has recorded through G-Cloud.
- Buyer. The public sector organisation that bought it. The dashboard labels this dimension Customer, and it also groups buying organisations by sector and by size.
- Lot. The category of service the sale sat in. The dashboard groups lots as Cloud Hosting, Cloud Software, Cloud Support, Lot 4 and the AWS One Government Value Agreement. Those groupings run across the whole series from 2012, so they are broader than the 5 lots G-Cloud 15 uses. For the current lot structure, read our Ultimate Guide to G-Cloud.
- Reporting period. The dashboard filters by Month and by Year of Reporting period, so you can hold a period steady while you compare suppliers, buyers or lots.
What can suppliers do with this data?
2 things, and they are what the data does best.
- See what your competitors are selling. Filter by Supplier to see what a named company has recorded through G-Cloud, in which lots and to which buyers.
- Find your public sector prospects. Filter by Customer or by sector, then use the organisation size view, to see who is buying in your category and how that has moved over time.
The dashboard breaks buying down 3 ways: by sector, by named customer and by size of organisation. So start with the sector view to see where your category sells, and then move to the customer view to name the organisations behind it. If you want the framework mechanics instead, such as how buyers award and what a call-off contract commits you to, read our Ultimate Guide to G-Cloud.
If you want help turning that into a target list and a pipeline, then that is where our framework sales and pipeline work starts.
How current is the G-Cloud spend data?
Where does the G-Cloud spend data come from?
Does the spend data cover every G-Cloud iteration?
Can I see G-Cloud spend for one supplier or one buyer?
What is the difference between this page and the Ultimate Guide to G-Cloud?
This page is the data: how much the public sector bought, from which suppliers and when. The Ultimate Guide to G-Cloud is the framework itself. It covers the lots, the application process, how buyers award and what a call-off contract commits you to. If you want the numbers, stay here. If you want the rules, start there.
Newsletter
Never miss a framework change
Register for our newsletter to be kept up to date with important framework changes and upcoming webinars.